Machine Learning Model
Once relevant features have been extracted and standardized from audio recordings, the next stage in the speech emotion recognition pipeline is model training. This is where machine learning is used to recognize patterns within the data and learn how different speech characteristics relate to specific emotional states. At this point, every audio file has been converted into a structured numerical format that captures variations in pitch, tone, speed, and energy — all of which are important clues for identifying emotion. However, the raw feature data itself does not yet provide any predictions. That role is fulfilled by a machine learning model.
Baseline Convolutional Neural Network
In this project, a convolutional neural network (CNN) is used to process the input features. CNNs are particularly effective at identifying patterns in structured data like images or spectrograms, which makes them well-suited for understanding the time-frequency patterns found in speech. The model is trained by showing it many examples of audio features paired with emotion labels (such as happy, sad, angry, etc.). Over time, the model learns which patterns are typically associated with each emotion. This learning process involves adjusting internal parameters — called weights — to minimize prediction errors. Once trained, the model can be used to classify new, unseen audio samples by analyzing their features and predicting the most likely emotional category. The goal is to create a model that not only performs well on the training data, but also generalizes to real-world examples where voices, speaking styles, and background conditions may vary.
Model Overview
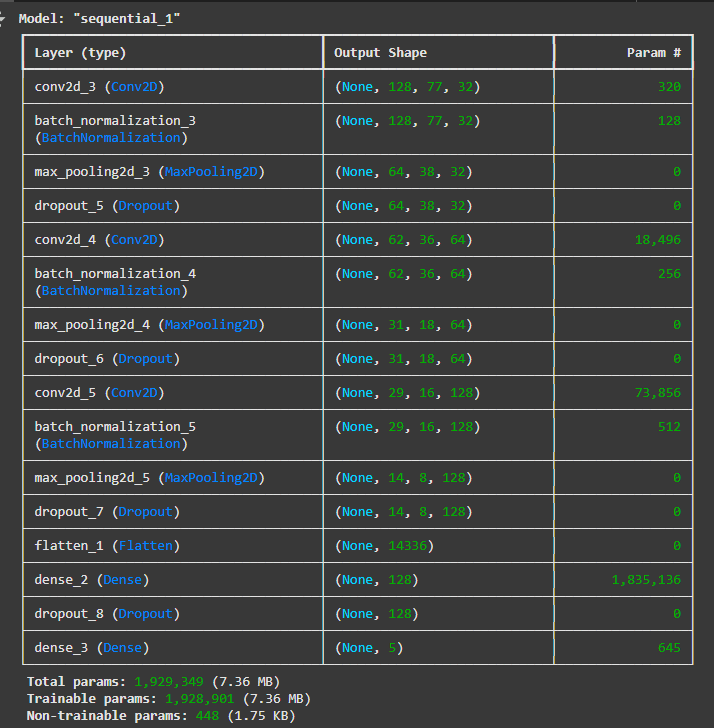
The first model developed for this project is a 16-layer CNN, designed to recognise
emotions in speech. It is built using a sequence of layers that process input data and classify it into
predefined emotional categories.
The model is structured into three main blocks for feature extraction. Each block begins with a Conv2D layer,
which scans the input to detect important patterns in the data. This is followed by a BatchNormalization layer,
which helps the model learn more efficiently by standardising the output. A MaxPooling2D layer then reduces the
amount of information, keeping only the most significant features. Finally, a Dropout layer is added to reduce
overfitting — helping the model generalise better to new, unseen data.
This pattern of Conv2D → BatchNormalization → MaxPooling2D → Dropout is repeated in all three blocks, with the
number of filters increasing in each block (32, 64, and 128 respectively) to allow the model to learn
progressively more detailed emotional features from the input.
After these three blocks, the output is passed through a Flatten layer, which reshapes the extracted features
into a simple, one-dimensional format. This is followed by a Dense layer (also called a fully connected layer)
that brings together everything the model has learned so far. Another Dropout layer is applied here as a
regularisation step. The final layer is a second Dense layer, which produces the predicted emotion category.
In total, the model includes approximately 1.93 million parameters. Most of these are trainable parameters,
meaning they are updated as the model learns from data. A small number are non-trainable, mainly used within the
batch normalisation layers to maintain stable learning.
This CNN serves as the foundation for emotion classification and acts as the baseline against which more advanced
models will be compared in later stages of the project.
Evaluation
The baseline CNN model was evaluated using two main tests: training/validation accuracy and loss curves,
and a classification report. Together, these tests provide insight into how well the model learned and how
accurately it identified specific emotions.
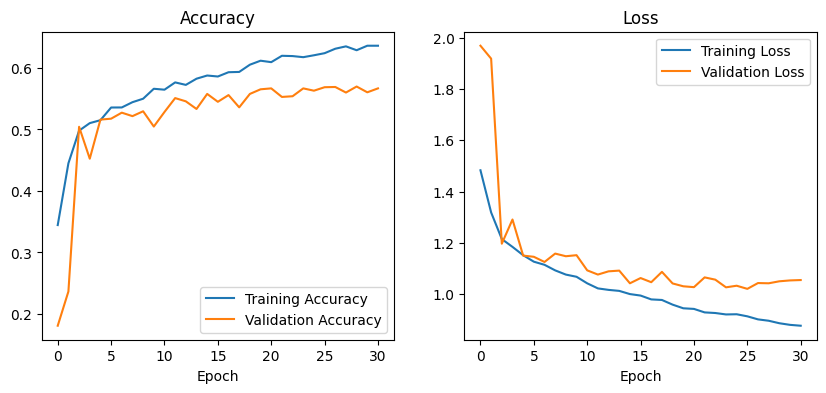
From the accuracy and loss curves, the model showed steady improvement during training, reaching about 66%
accuracy on the training set and 58–60% on the validation set. This indicates that the model was learning
patterns in the data. However, the gap between training and validation accuracy, along with a higher validation
loss (around 1.0 compared to training loss below 0.9), suggests the model did not generalise as well to new,
unseen data — a common issue known as overfitting.
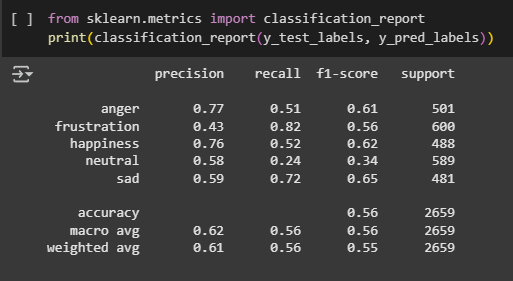
The second evaluation used a classification report, which provided detailed results for each emotion using three
key metrics: precision, recall, and F1-score.
- The precision scores showed that the model was most accurate when predicting anger (0.77) and happiness (0.76) — meaning it was usually correct when it chose these labels.
- The recall values revealed that the model was especially good at detecting frustration, with a high score of 0.82. However, its precision for frustration was lower (0.43), indicating it often confused other emotions as frustration.
- The F1-score, which balances both precision and recall, was strongest for sadness (0.65) and happiness (0.62), reflecting solid overall performance for these emotions.
- The weakest results were for neutral speech, with a recall of 0.24 and an F1-score of 0.34, showing that the model often failed to identify neutral expressions correctly.
This model provides a solid starting point and sets a clear benchmark for evaluating more complex approaches in the next stages of the project.
CNN-LSTM Hybrid Architecture
Because the initial CNN model showed signs of limited generalization and struggled with certain emotion classes — especially neutral (with low recall and F1-score) — I decided to experiment with a more advanced architecture that could better capture the temporal dynamics of speech. CNNs are powerful at identifying local patterns in spectrograms, but they do not fully account for time-dependent relationships that are important for understanding the flow of spoken emotion. To address this, I implemented a CNN-LSTM hybrid model, which combines the spatial feature extraction of convolutional layers with the sequence modeling abilities of Long Short-Term Memory (LSTM) units.
Model Overview
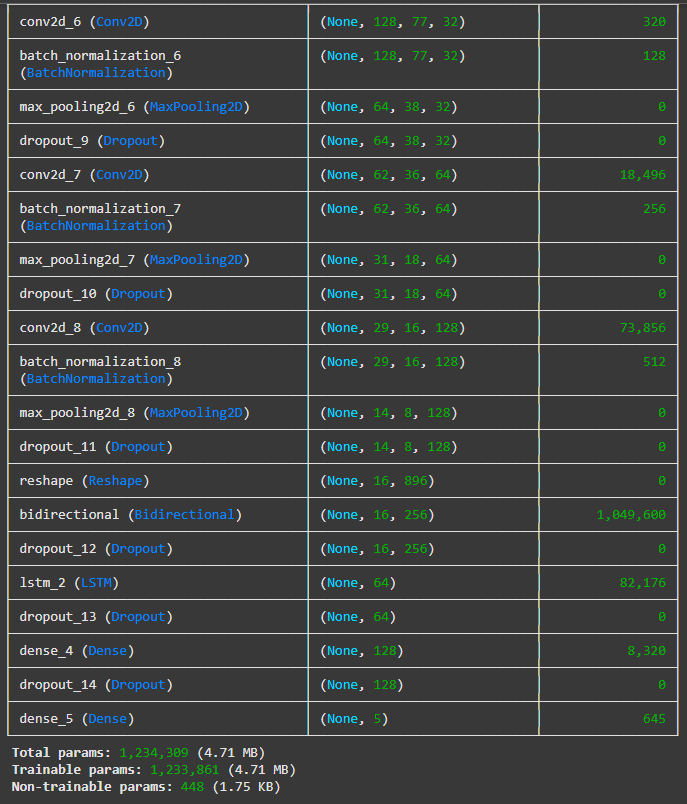
The second model builds on the baseline CNN by integrating an LSTM layer, making it better suited for
recognising patterns that unfold over time — an important factor in speech emotion recognition.
The architecture begins similarly to the previous model, with three blocks of convolution, normalisation,
pooling, and dropout layers. These layers work together to extract key features from the input data while
reducing overfitting and focusing on the most important information.
After feature extraction, the output is reshaped and passed into a Bidirectional layer, which allows the
model to learn from both past and future contexts in the sequence. This is followed by an LSTM layer,
which captures temporal relationships in the speech data — helping the model recognise how emotions develop
over time, not just in isolated fragments.
The output from the LSTM is then passed through two fully connected Dense layers, with a final output layer
responsible for predicting the emotion category.
This model includes a total of 1,234,309 parameters, the majority of which are trainable. While it has fewer
total parameters than the baseline CNN, it introduces more powerful sequence-processing capabilities through
the LSTM and Bidirectional layers, offering a new approach to capturing emotional patterns across time.
This combined architecture sets the stage for evaluating how well temporal modelling improves emotion
recognition compared to a CNN alone.

Evaluation
The CNN-LSTM model was evaluated using training and validation accuracy/loss graphs and a classification
report. These results show that the model improved steadily over time, reaching around 65% training accuracy
and close to 60% validation accuracy. The gap between the two remained smaller than in the previous model,
and validation loss stayed consistently lower, suggesting better generalisation and less overfitting.
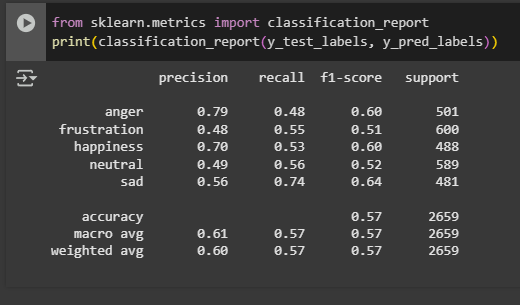
The classification report shows that the model achieved an overall accuracy of 57%, a slight improvement
over the CNN-only model. The macro average F1-score also increased to 0.57, indicating more balanced
performance across different emotions.
In terms of specific emotion categories:
- Anger and happiness showed strong results, with precision scores of 0.79 and 0.70, meaning the model was often correct when it predicted these.
- Sadness had the highest recall (0.74) and a solid F1-score of 0.64, showing it was detected consistently and accurately.
- Neutral and frustration remained more challenging, with lower F1-scores (0.52 and 0.51), although performance still improved slightly compared to the previous model.
CNN with Bidirectional LSTM + GRU
Because the CNN-LSTM model, while more effective than the initial CNN, still showed limited recall for several emotions and a tendency to plateau in validation accuracy (~58%), I decided to develop a third, more refined model. The goal was to keep the strengths of the CNN-LSTM approach, especially its ability to learn from time-based features in speech, while improving generalisation. The new model uses a combination of CNN with both Bidirectional and GRU layers. GRUs (Gated Recurrent Units) are a type of layer similar to LSTMs but are smaller and faster, making the model more efficient. By using a GRU instead of an LSTM, and still keeping the Bidirectional setup (which looks at the speech sequence in both directions), the model can better understand the flow of emotions in speech without becoming heavier or slower.
Model Overview
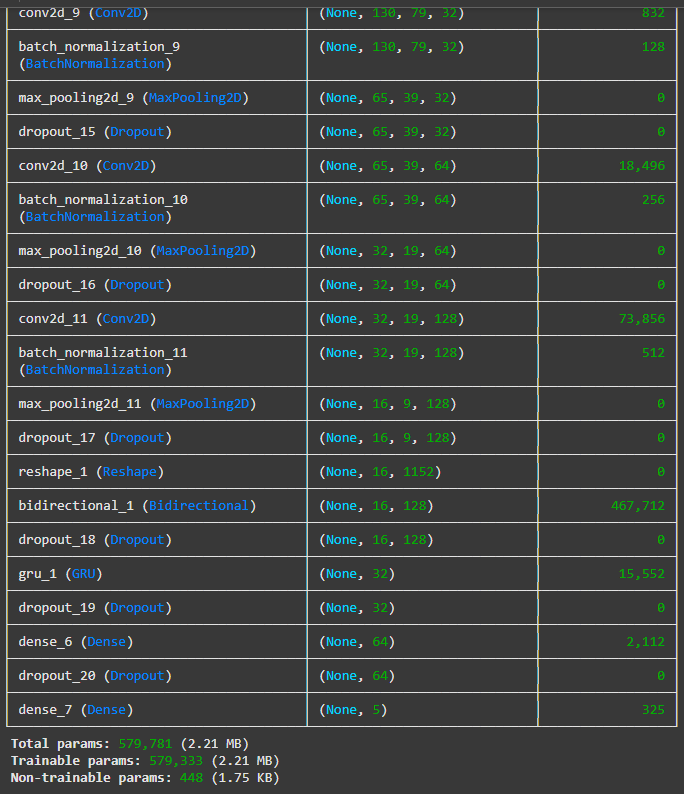
The CNN-GRU model follows a similar structure to the previous ones, starting with three convolutional blocks
that extract key features from the input. Each block includes convolution, batch normalisation, max pooling,
and dropout layers to ensure stable and efficient learning while reducing the risk of overfitting.
What sets this model apart is how it handles the time-based nature of speech. Instead of LSTM layers, it uses
Gated Recurrent Unit layers, which are more lightweight and require fewer parameters. GRUs are efficient at
learning patterns over time, making the model faster while still capturing emotional changes in speech.
A Bidirectional GRU layer is included to process the input sequence in both directions — forward and backward
— allowing the model to understand the full context of what was said, which is especially important for
recognising emotions accurately.
After this sequence processing stage, the output moves through two fully connected Dense layers that handle
the final emotion classification. A dropout layer is also applied before the output to support
regularisation.
With around 579,781 parameters, this model is much smaller than the previous architectures, yet it remains
highly capable in detecting emotional patterns. Thanks to its balance of speed, accuracy, and generalisation,
the CNN-GRU was chosen as the final model for this project and is used in all subsequent evaluations and
testing.
Training Validation Metrics and Test Accuracy
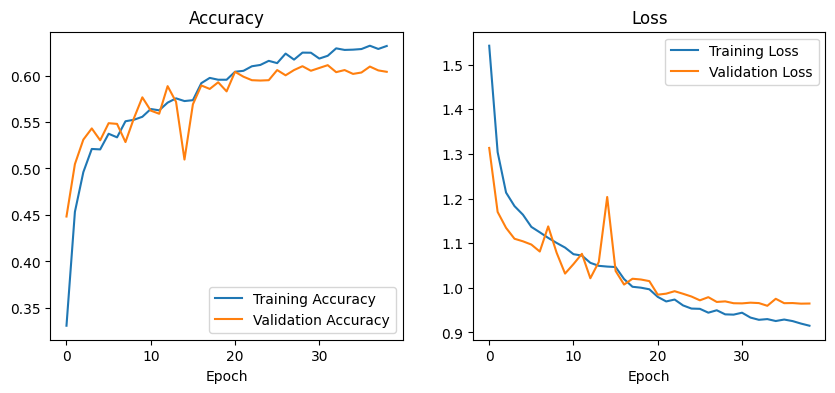
The CNN-GRU model demonstrated steady and consistent learning throughout the training process. As shown
in the accuracy plot, it reached over 62% training accuracy and nearly 61% validation accuracy, with both
curves following a similar path. This indicates that the model was not only learning effectively but was
also generalising well to unseen data. The training and validation loss curves also remained closely
aligned, showing no signs of overfitting.
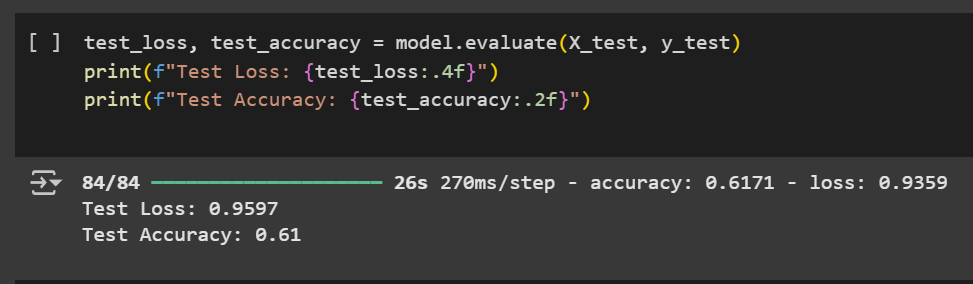
Final performance on the test dataset confirms this stability. The model achieved a test accuracy of 61%
and a test loss of 0.96, further supporting that it performs reliably across all evaluation phases —
training, validation, and testing.
Compared to earlier models, the CNN-GRU showed improved consistency, slightly higher overall accuracy,
and more balanced learning. It maintained a close match between training and validation results, which
was not the case in the CNN-only model. Although its accuracy is similar to the CNN-LSTM, this model
offers better efficiency due to a smaller number of parameters.
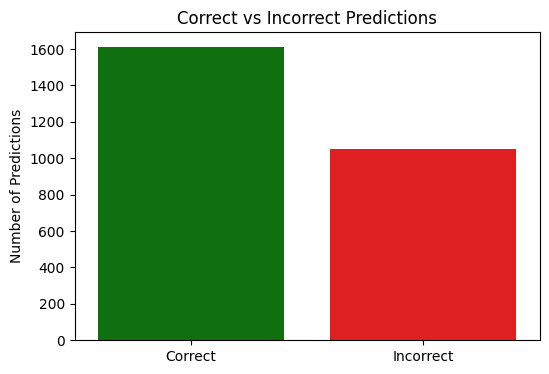
Prediction Accuracy Overview
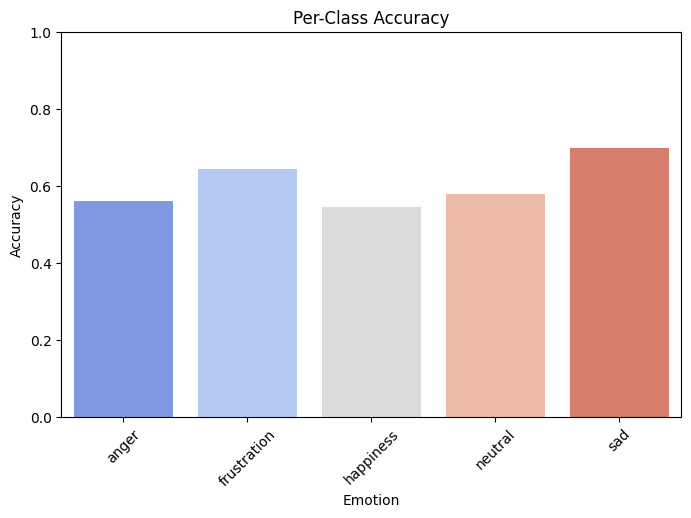
The correct vs incorrect prediction chart shows that the CNN-GRU model correctly predicted the emotion in over 1,600 cases, with around 1,000 incorrect predictions out of the total test set. This aligns with the model's overall test accuracy of 61%, indicating generally reliable performance across the dataset.The per-class accuracy chart gives a more detailed view of how the model performed on each emotion. Among the five classes:
- Sadness was the most accurately predicted, with an accuracy of around 70%.
- Frustration and neutral followed, both with accuracy levels around 60–65%, showing the model was able to identify these emotions with reasonable consistency.
- Anger and happiness had slightly lower accuracy, closer to 55%, suggesting these emotions were more frequently misclassified, likely due to overlapping vocal cues with other categories.
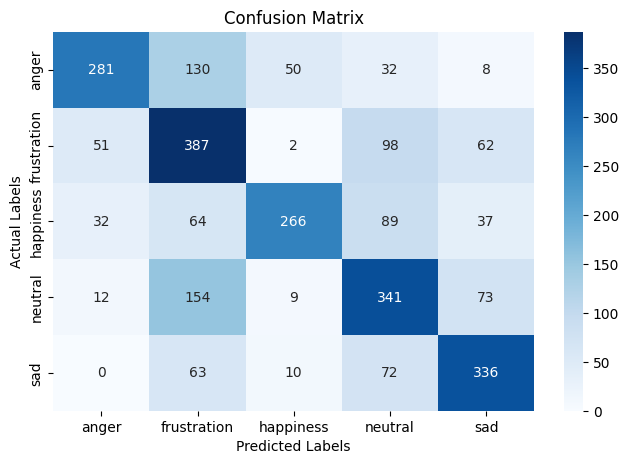
Confusion Matrix Analysis
The confusion matrix provides a detailed breakdown of how well the CNN-GRU model predicted each
emotion compared to the actual labels in the test set.
The model correctly classified the majority of samples in each emotion category, with the highest
correct counts seen for frustration (387), neutral (341), and sadness (336). This indicates that the
model reliably recognises these emotions in many cases.
However, the matrix also shows where the model tended to make mistakes:
- Anger was often confused with frustration (130 times) and happiness (50 times).
- Neutral was occasionally misclassified as frustration (154 times), showing that the model sometimes struggles to distinguish between low-expressiveness emotional states.
- Sadness was frequently confused with frustration (63) and neutral (72), which may be due to overlapping vocal characteristics in emotional tone.
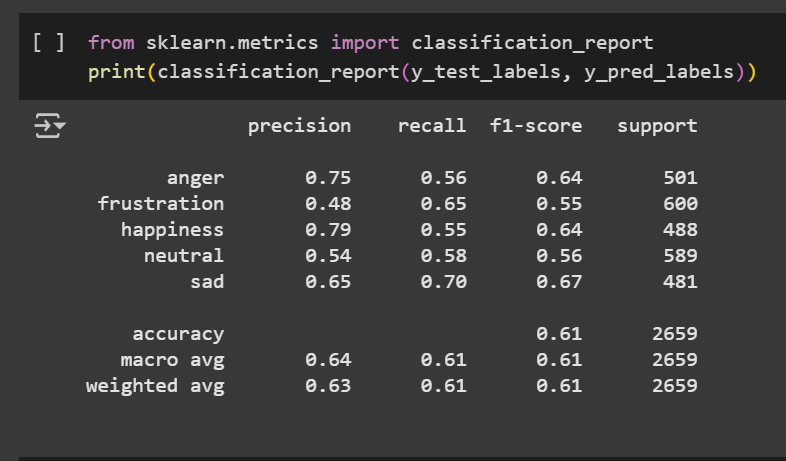
Final Classification Results
The final classification report confirms that the CNN-GRU model achieved an overall accuracy of 61% on the test dataset. This result reflects solid general performance across all emotion categories. Looking at the individual scores:
- The model performed best on happiness, with a precision of 0.79, showing that most happiness predictions were correct.
- Sadness had the highest recall (0.70) and F1-score (0.67), indicating that it was detected reliably and consistently.
- Emotions like anger and neutral also showed balanced results, with F1-scores of 0.64 and 0.56, respectively.
- Frustration was more challenging, with the lowest overall scores (F1-score of 0.55), though still improved compared to earlier models.