Features
In Speech Emotion Recognition (SER), emotional cues are often hidden in vocal characteristics like tone, pitch, and intensity. Feature extraction is the process of converting raw audio into meaningful numerical representations that a machine learning model can understand. Since raw waveforms are too complex for direct analysis, we transform them into structured features that highlight patterns related to human emotions. Extracting the right features helps the model learn to distinguish between emotions like happiness, sadness, anger, frustration and neutrality.
Waveform
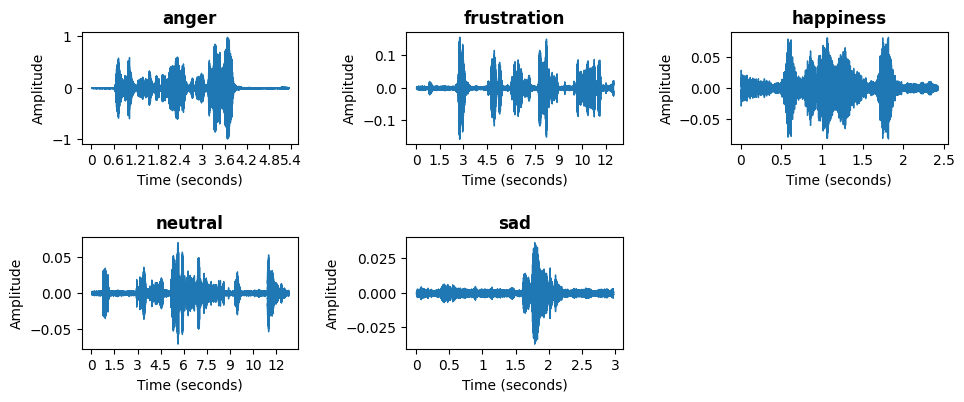
The figure illustrates waveform representations of different emotions in speech signals, including anger, frustration, happiness, neutral, and sad. A waveform is a graphical representation of a sound wave, where the x-axis represents time in seconds, and the y-axis represents amplitude, which indicates the intensity of the sound. These waveforms highlight the distinct characteristics of each emotional state. For instance, the waveforms associated with anger and happiness exhibit high variations and energy, reflecting strong vocal expressions. In contrast, the neutral and sad emotions display lower amplitude fluctuations, indicating more subdued speech patterns. The differences in these waveforms demonstrate how emotions influence speech signals, affecting pitch, intensity, and rhythm. Analyzing these waveform features is crucial for speech emotion recognition (SER) models, as they provide essential information for distinguishing between emotional states.
Mel-Spectrogram
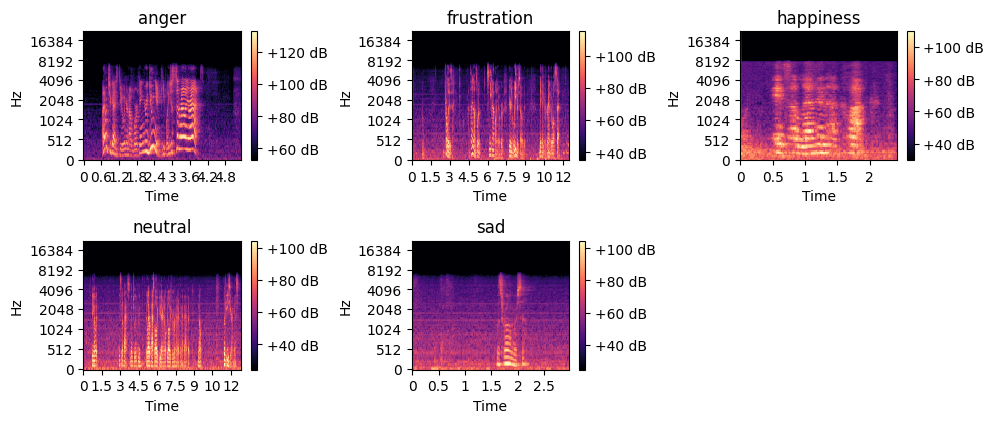
The figure presents spectrogram representations of selected emotions. A spectrogram is a visual representation of the frequency content of a sound signal over time, where the x-axis represents time, the y-axis represents frequency in Hertz (Hz), and the color intensity indicates the amplitude or energy of the signal in decibels (dB). Brighter regions correspond to higher energy levels, while darker areas indicate lower energy. These spectrograms highlight the unique frequency patterns associated with each emotional state. For example, the spectrogram of anger and frustration exhibits high-energy regions across a wide range of frequencies, reflecting intense vocal expressions. In contrast, the spectrograms for neutral and sad emotions display lower energy levels, particularly in the higher frequency range, indicating more subdued speech. Analyzing these spectrograms is essential for speech emotion recognition (SER) as they capture both time and frequency domain features, providing valuable information for distinguishing between different emotions.
Mel-Frequency Cepstral Coefficients (MFCCs)
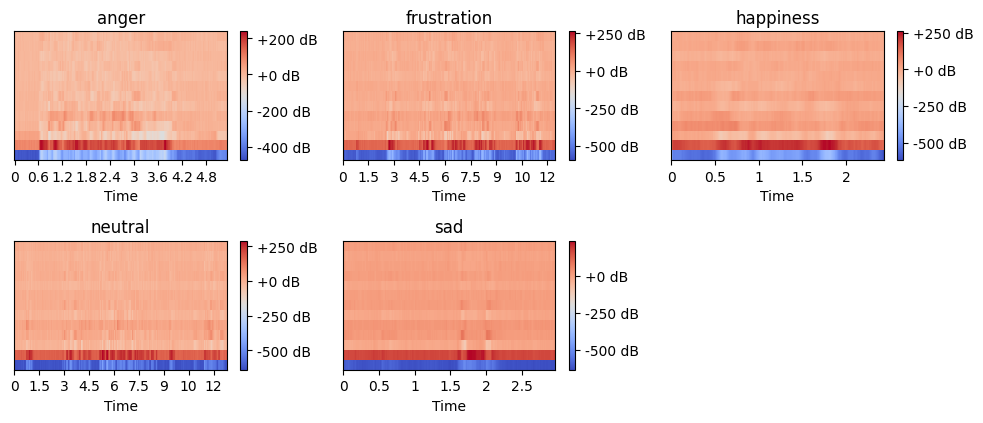
The figure displays mel-spectrograms for selected emotional speech samples. A mel-spectrogram represents the frequency content of an audio signal on the mel scale, which better reflects human auditory perception. The x-axis represents time, while the y-axis corresponds to frequency in mel scale. The color intensity indicates amplitude in decibels (dB), where red represents higher energy and blue signifies lower energy. These visualizations capture variations in speech patterns across emotions. For instance, anger and frustration tend to have more intense energy variations, while neutral and sad emotions display lower amplitude and smoother transitions. Mel-spectrograms are widely used in speech emotion recognition tasks as they provide meaningful frequency features for classification models.
Root Mean Square
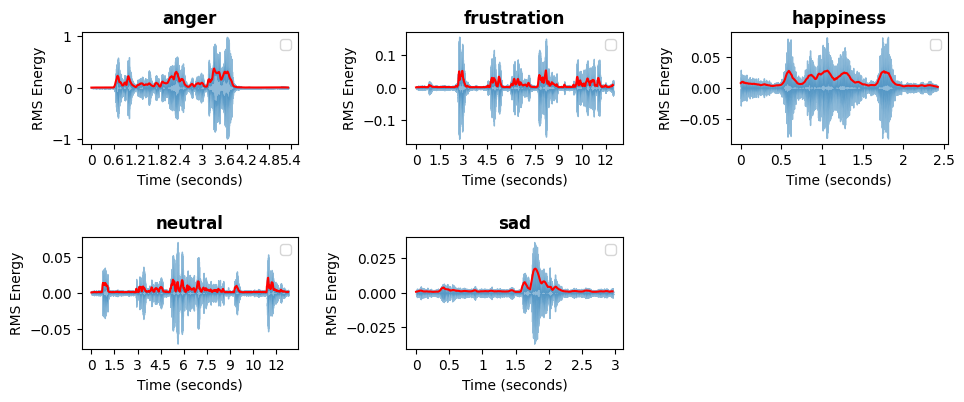
The figure presents the Root Mean Square (RMS) energy plots for emotional speech samples. RMS energy represents the power of the audio signal over time and provides insights into the intensity variations of speech. The x-axis represents time in seconds, while the y-axis corresponds to RMS energy. The blue waveform displays the raw signal energy, and the red line represents the smoothed RMS energy trend. Higher peaks indicate more intense speech, commonly associated with emotions like anger and frustration, while lower energy levels, as seen in sadness, reflect softer and less dynamic speech patterns. RMS energy is a crucial feature in speech emotion recognition, as it helps distinguish emotions based on their intensity and loudness characteristics.
Zero-crossing Rate
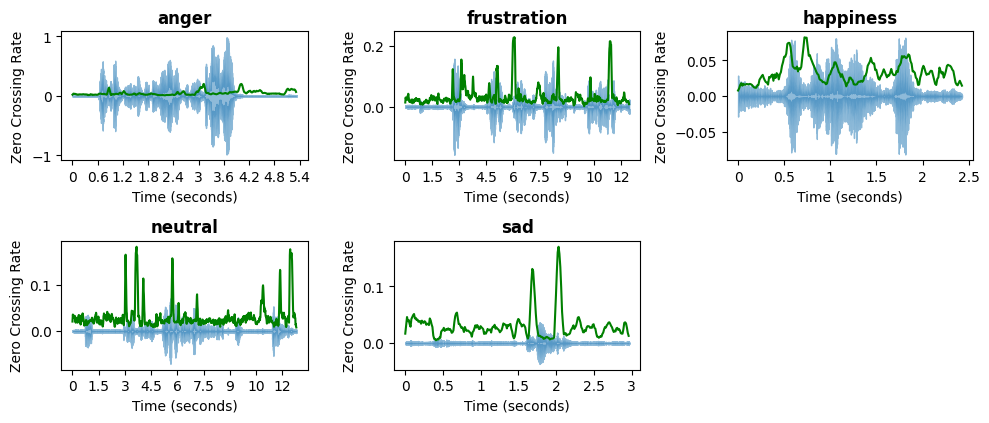
The figure illustrates the zero-crossing rate (ZCR) of different emotional speech samples. The zero-crossing rate represents the number of times the signal crosses the zero amplitude axis, which is an indicator of the speech's frequency characteristics. The x-axis represents time in seconds, while the y-axis corresponds to the ZCR values. The blue waveform represents the original audio signal, while the green line tracks the variations in ZCR over time. Higher ZCR values, as seen in frustration and neutral speech, suggest more rapid changes in frequency, characteristic of energetic or unsteady speech. Lower ZCR values, such as in sadness, indicate slower variations, typically associated with calmer and more stable speech patterns. This feature is widely used in speech processing for distinguishing between voiced and unvoiced sounds and plays a key role in emotion recognition.
Extracted Features
Once the features have been extracted from each audio clip they are combined into a single, structured input. By concatenating these features, we create a rich and multi-dimensional representation of each audio clip that reflects both the acoustic properties and emotional tone of the speech. However, because these features can vary widely in scale and range, a standardization process is applied to ensure consistency. It involves transforming the data so that it has a mean of zero and a standard deviation of one. This step is essential for preparing the data for input into the machine learning model, as it ensures that no individual feature disproportionately influences the learning process due to its numerical scale. Once standardized, the features are reshaped into the format required by the convolutional neural network (CNN) — a fixed-size array with defined dimensions for time steps, features, and channels. This final preprocessed data is then used to train and test the model, enabling it to learn patterns in the speech that are associated with different emotional states.